SaaS Analytics Dashboard
Real-Time Business Intelligence — 10× Faster Data Processing
Project Details
Project Overview
A Series B SaaS company had a critical gap: their analytics took 4–6 hours to refresh, queried production DBs causing customer-facing latency, and offered only 7 fixed charts with zero drill-down. Strategic decisions were made on stale data.
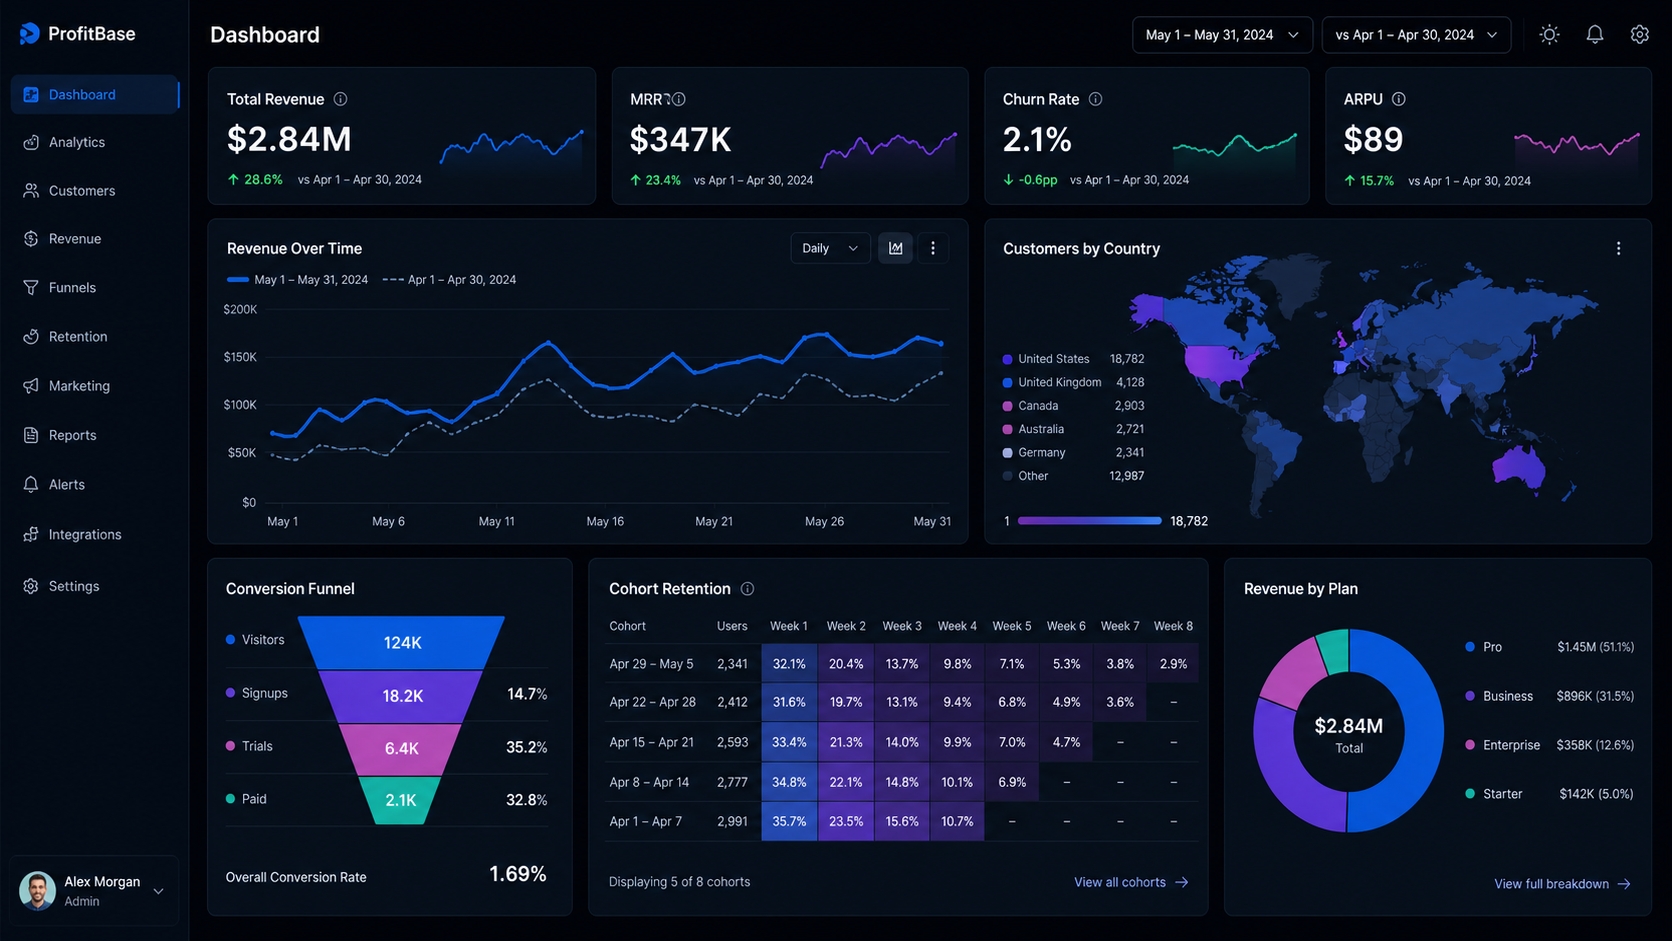
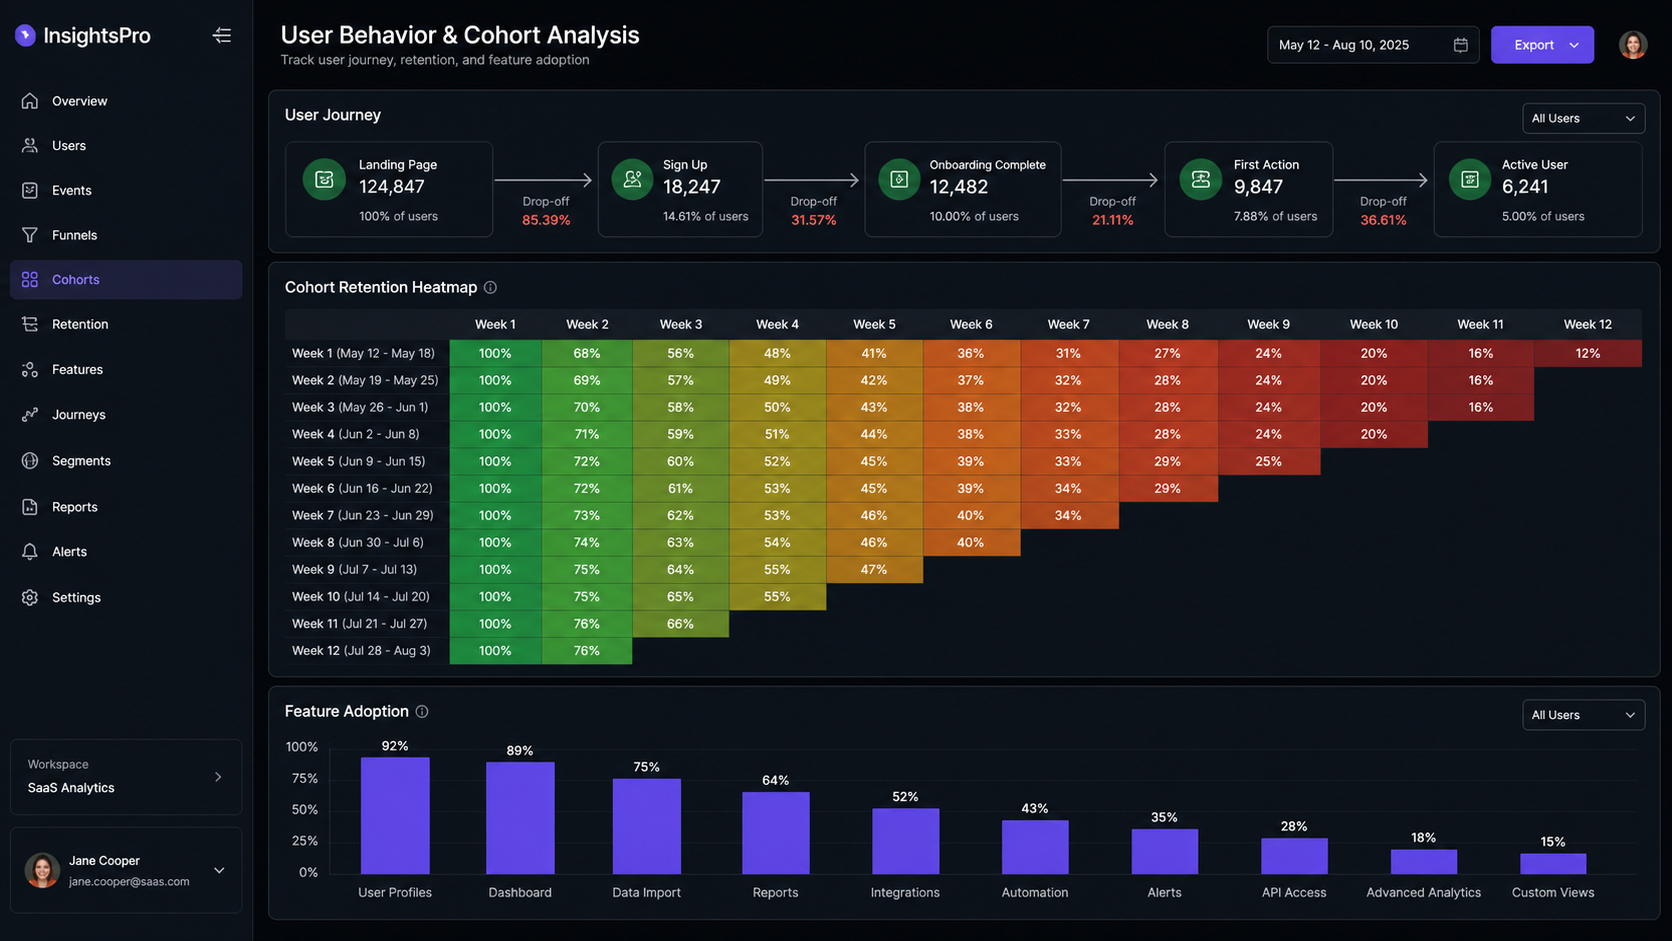
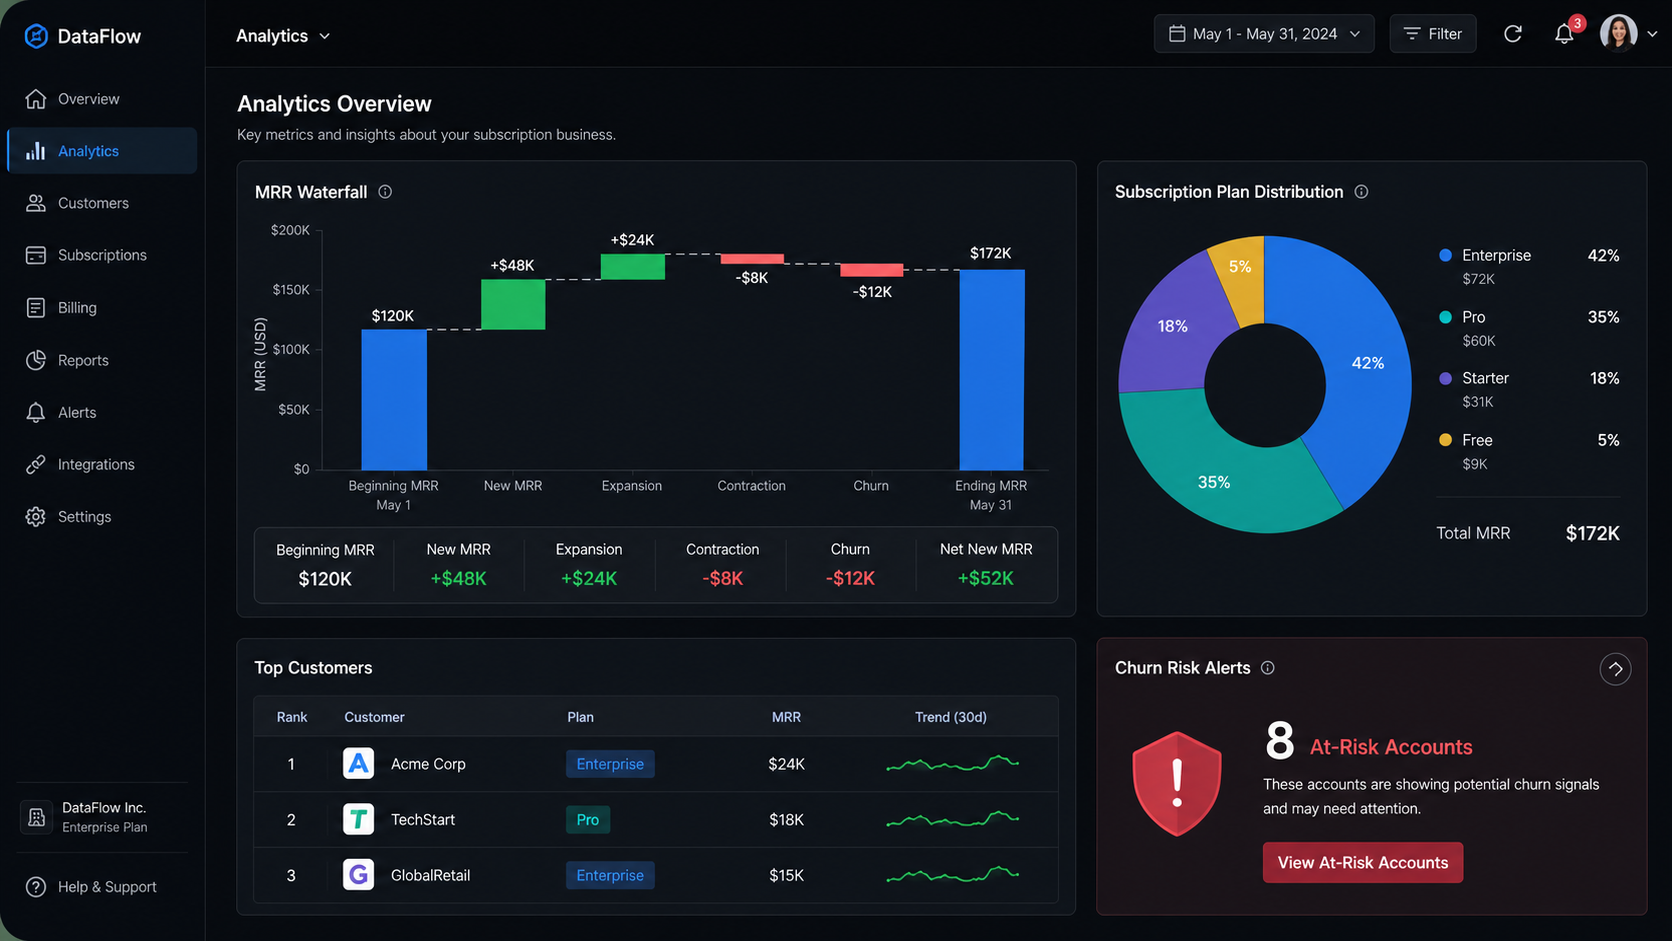
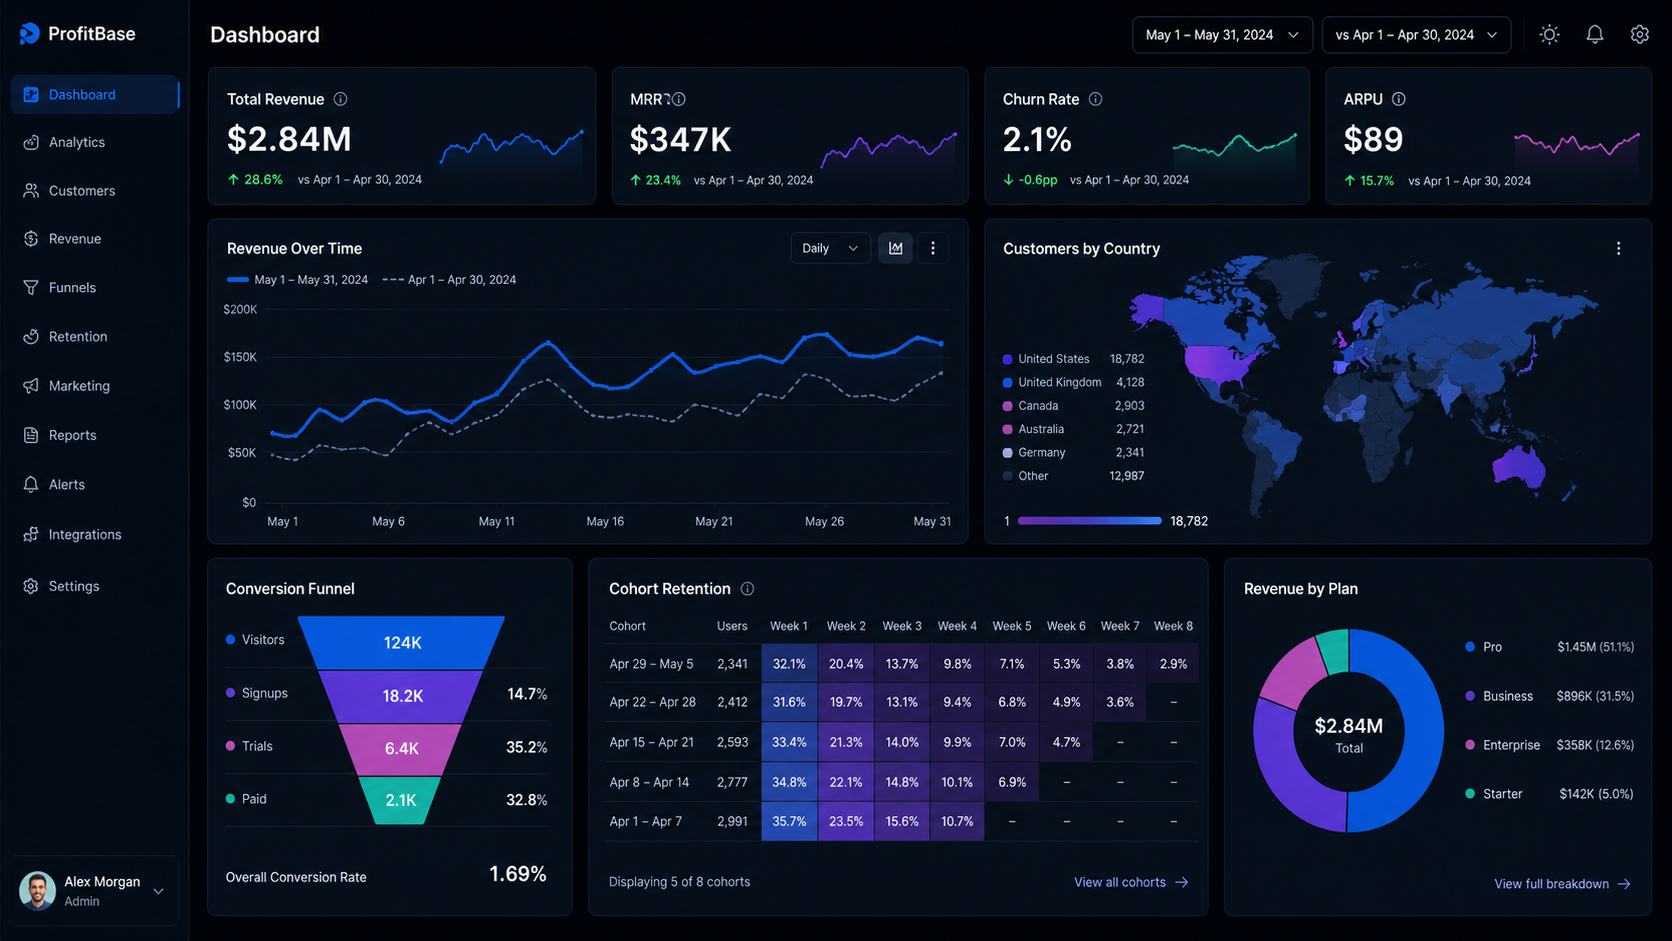
XCodeSol built a streaming pipeline: Debezium + Kafka Connect for CDC from PostgreSQL (zero production impact), feeding a 3-node ClickHouse cluster — queries that took 4 hours now run in 200ms. Next.js + D3.js frontend with 15 chart types, cross-filtering, 4-level drill-down (Revenue→Region→Country→Rep→Deal), virtual scrolling for 100K-row tables.
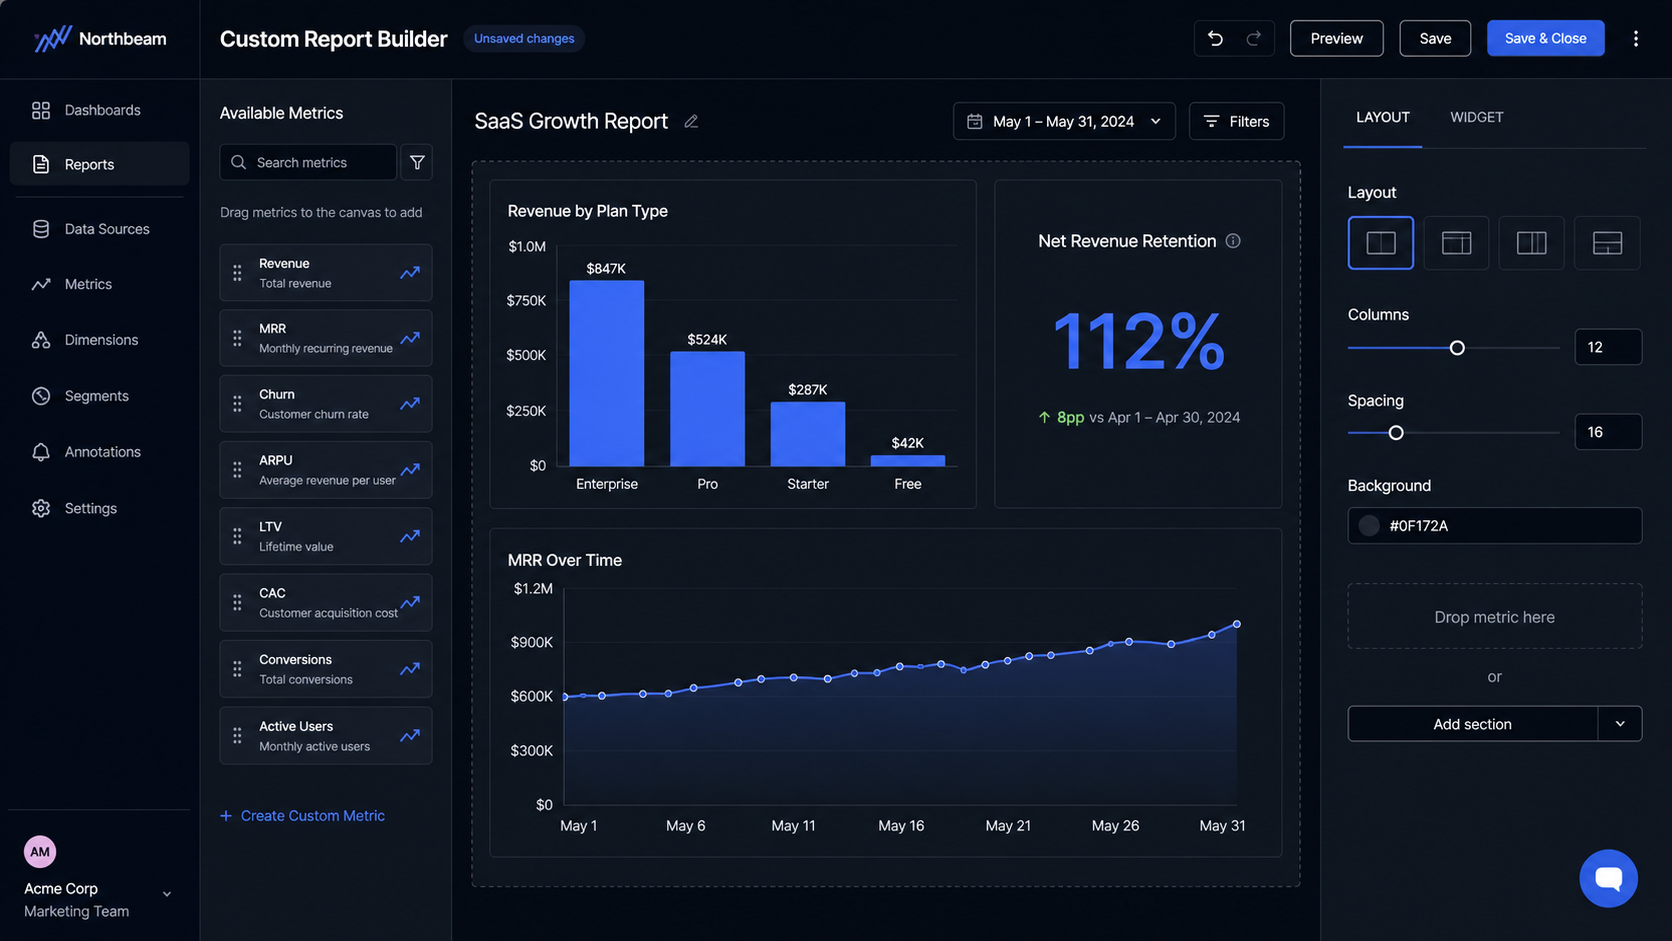
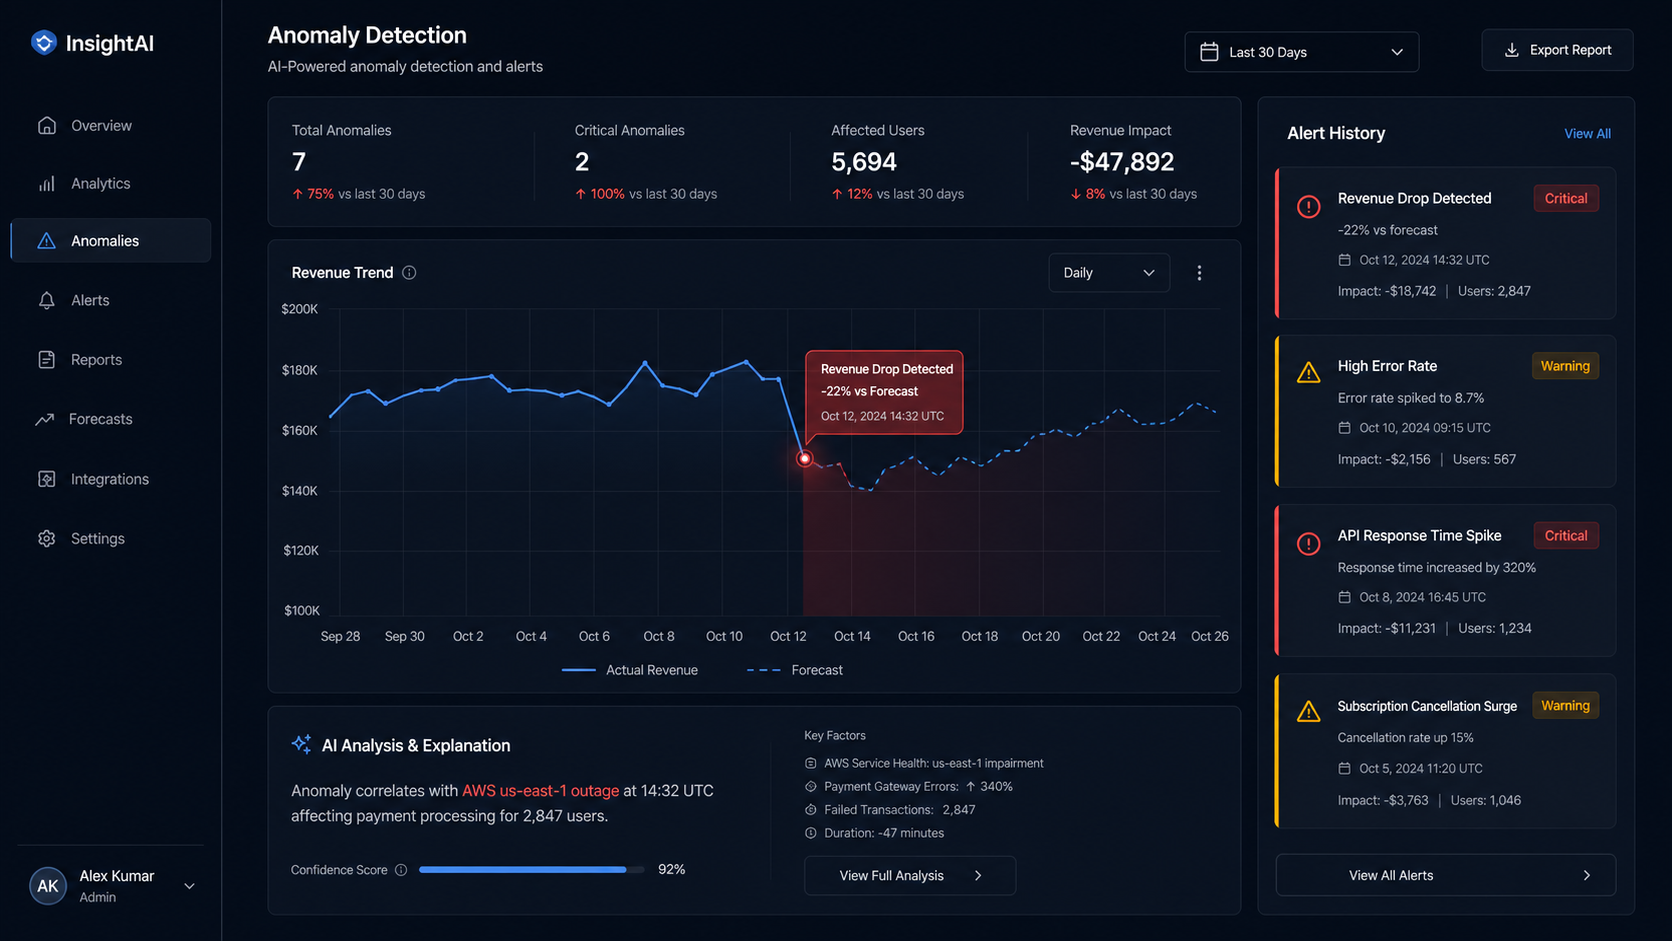
Custom drag-and-drop Report Builder lets non-engineers answer questions in under 2 minutes (was 6-week engineering ticket). AI anomaly detection via Facebook Prophet catches revenue anomalies in real-time with Slack alerts. Dashboard adoption: 3 → 127 users across all departments.
Key Features
Real-Time Data Pipeline
- •Debezium + Kafka Connect CDC from PostgreSQL
- •3-node ClickHouse cluster: 4 hr queries → 200ms
- •Zero production DB impact via change data capture
Interactive D3.js Dashboard
- •15 chart types with cross-filtering on click
- •4-level drill-down: Revenue → Region → Country → Deal
- •Virtual scrolling for 100K-row data tables
Drag-and-Drop Report Builder
- •200+ pre-modeled KPIs with auto-suggested charts
- •Saved reports shareable via URL, embeddable in Slack
- •Scheduled email delivery: "Email me Mondays at 8 AM"
AI Anomaly Detection
- •Facebook Prophet for time-series forecasting
- •3-sigma anomaly detection on 12 key metrics
- •Real-time Slack alerts with root cause correlation
Enterprise-Grade Architecture
- •Kubernetes deployment on AWS EKS
- •Star schema optimized for top 50 analytical queries
- •Cost per query dropped 99% ($0.18 → $0.002)
Results at a Glance
| Data Refresh Time | ↓ 99.99% (4–6 hrs → <3 sec) |
| Production DB Impact | Zero (CDC pipeline) |
| Time to Answer Questions | ↓ 99.99% (6 weeks → <2 min) |
| Quarterly Forecasting | ↓ 99.8% (3 days → 10 min automated) |
| Dashboard Adoption | 42× (3 → 127 users) |
| Cost Per Query | ↓ 99% ($0.18 → $0.002) |
“XCodeSol built us an analytics platform that transformed how we make decisions. Data that took hours is now available in seconds. The report builder put analytics in every department's hands.”
Project Gallery