Custom CRM for Logistics
Real-Time Fleet Management — 40% Faster Deliveries
Project Details
Project Overview
A Dubai logistics company managing 3,000+ daily shipments was operating on Excel trackers, WhatsApp groups, and a decade-old desktop CRM requiring VPN. Dispatchers manually called drivers; customers had zero visibility; routes were chosen by driver intuition.
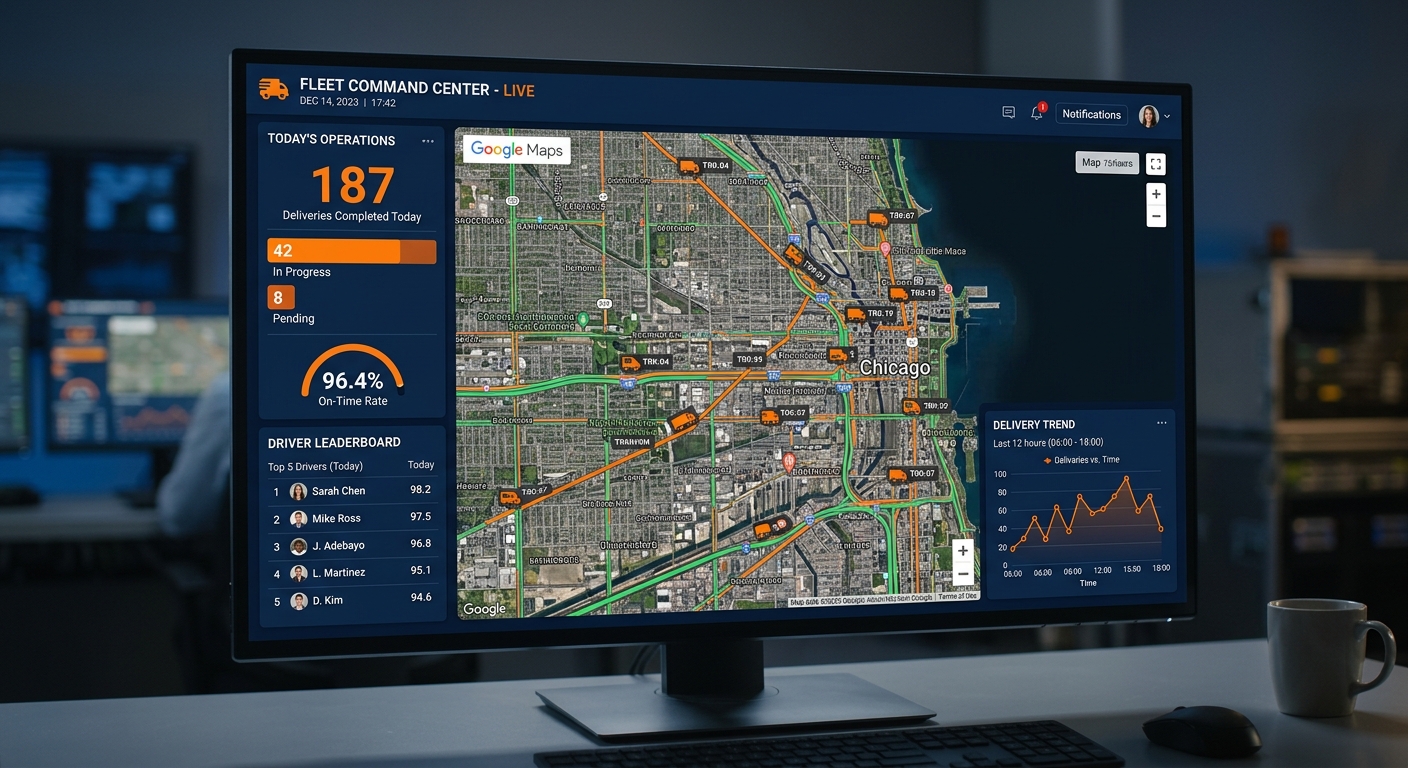
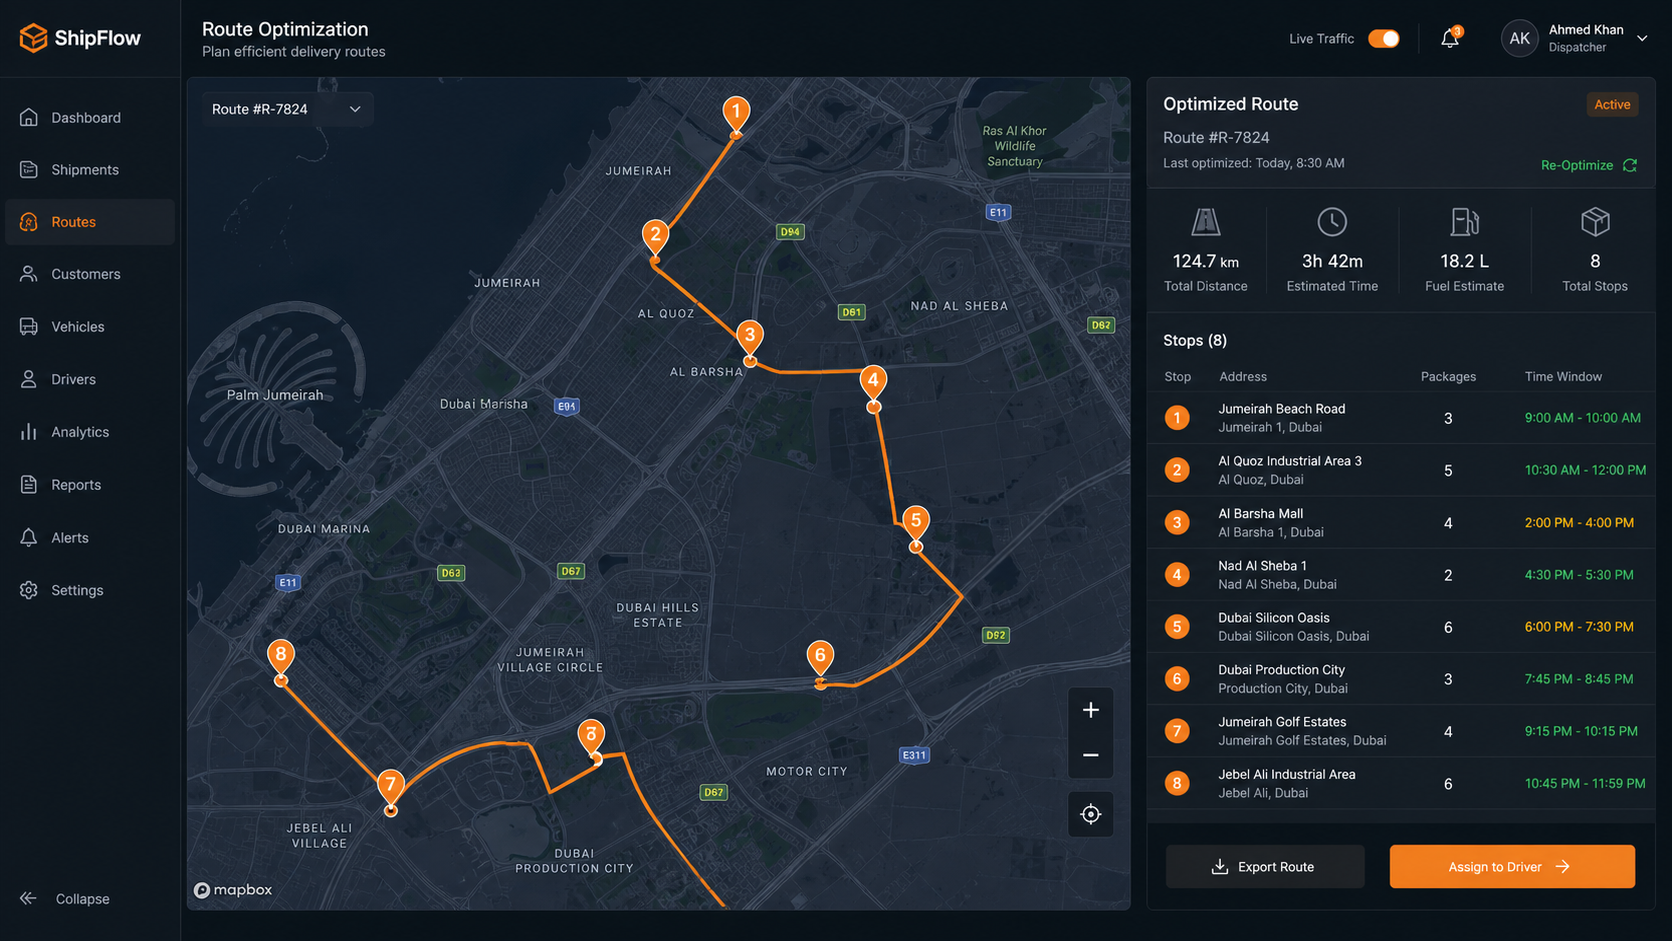
XCodeSol built a cloud-native logistics CRM: AI Smart Dispatching Engine evaluates drivers on GPS proximity, load, rating, and shift hours — auto-assigns in under 30 seconds (was 45+ minutes). Real-time tracking via driver PWA updating GPS every 30 seconds over Socket.IO; automated SMS alerts cut customer calls by 95%. Route optimization using modified Clarke-Wright algorithm with Google Distance Matrix — multi-stop, traffic-aware, with time-window constraints. Digital POD eliminated paper proofs entirely, cutting invoicing from 2 weeks to same-day.
On-site training for 40+ dispatchers and 150+ drivers. 2-week parallel run ensured zero disruption. Deliveries per driver jumped 59%, fuel dropped 22%, customer churn fell from 12% to 3%.
Key Features
AI-Powered Auto-Dispatching
- •Evaluates drivers on GPS proximity, load, rating & shift hours
- •Auto-assigns optimal driver in <30 seconds (was 45+ min)
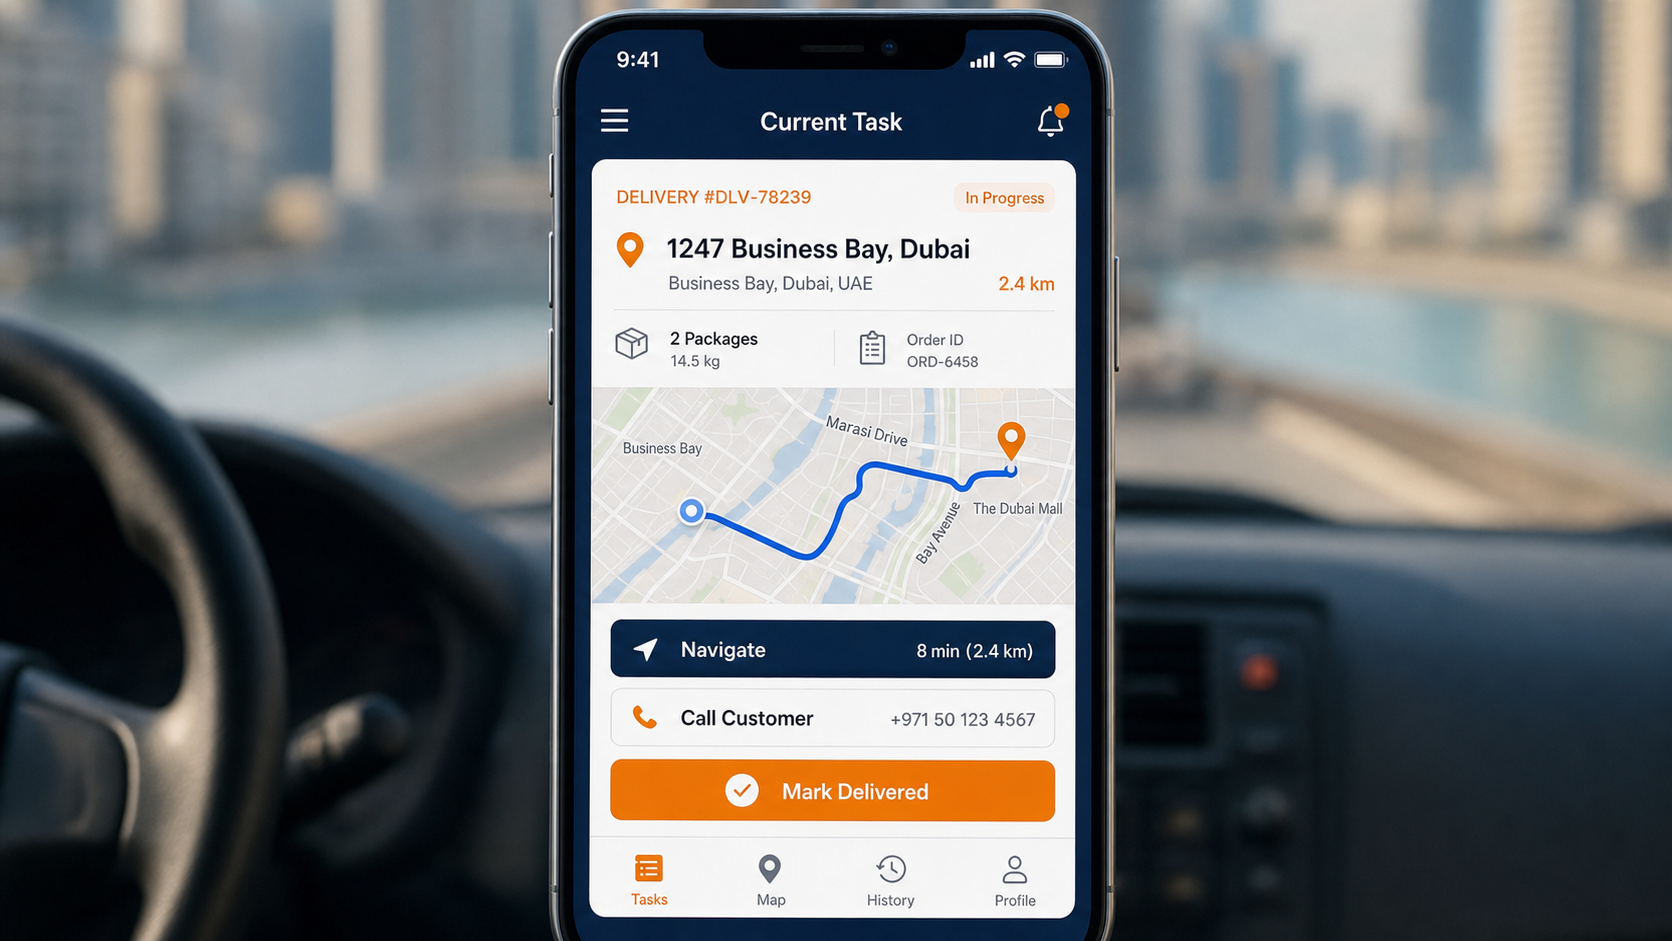
- •One-tap driver accept/decline with automatic reassignment
Real-Time GPS Tracking
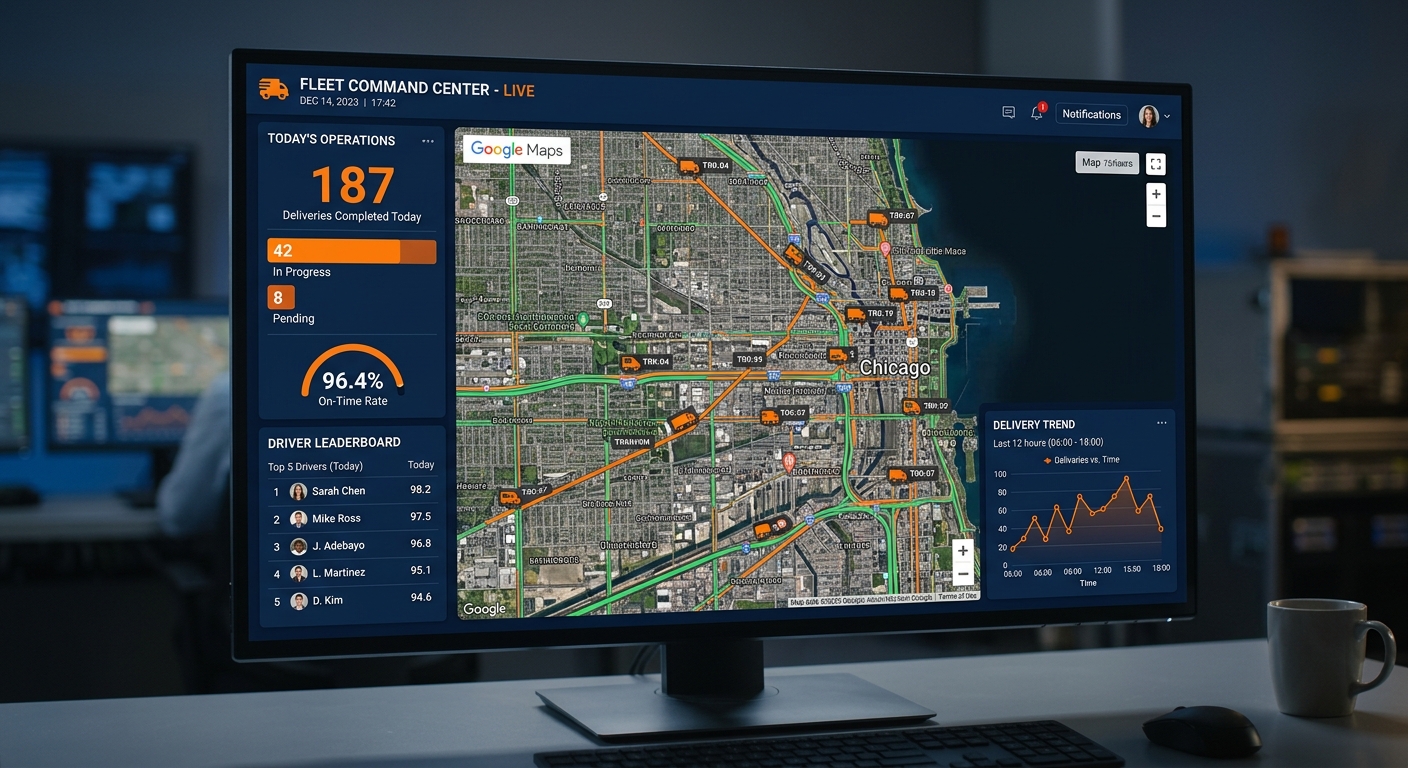
- •Driver PWA updates location every 30 sec via Socket.IO
- •Customer portal with live map & dynamic ETA
- •Automated SMS alerts: 95% fewer customer calls
AI Route Optimization
- •Modified Clarke-Wright algorithm with Google Distance Matrix
- •Multi-stop optimization with traffic-aware routing
- •Time-window constraints & vehicle-specific restrictions
Digital Proof of Delivery
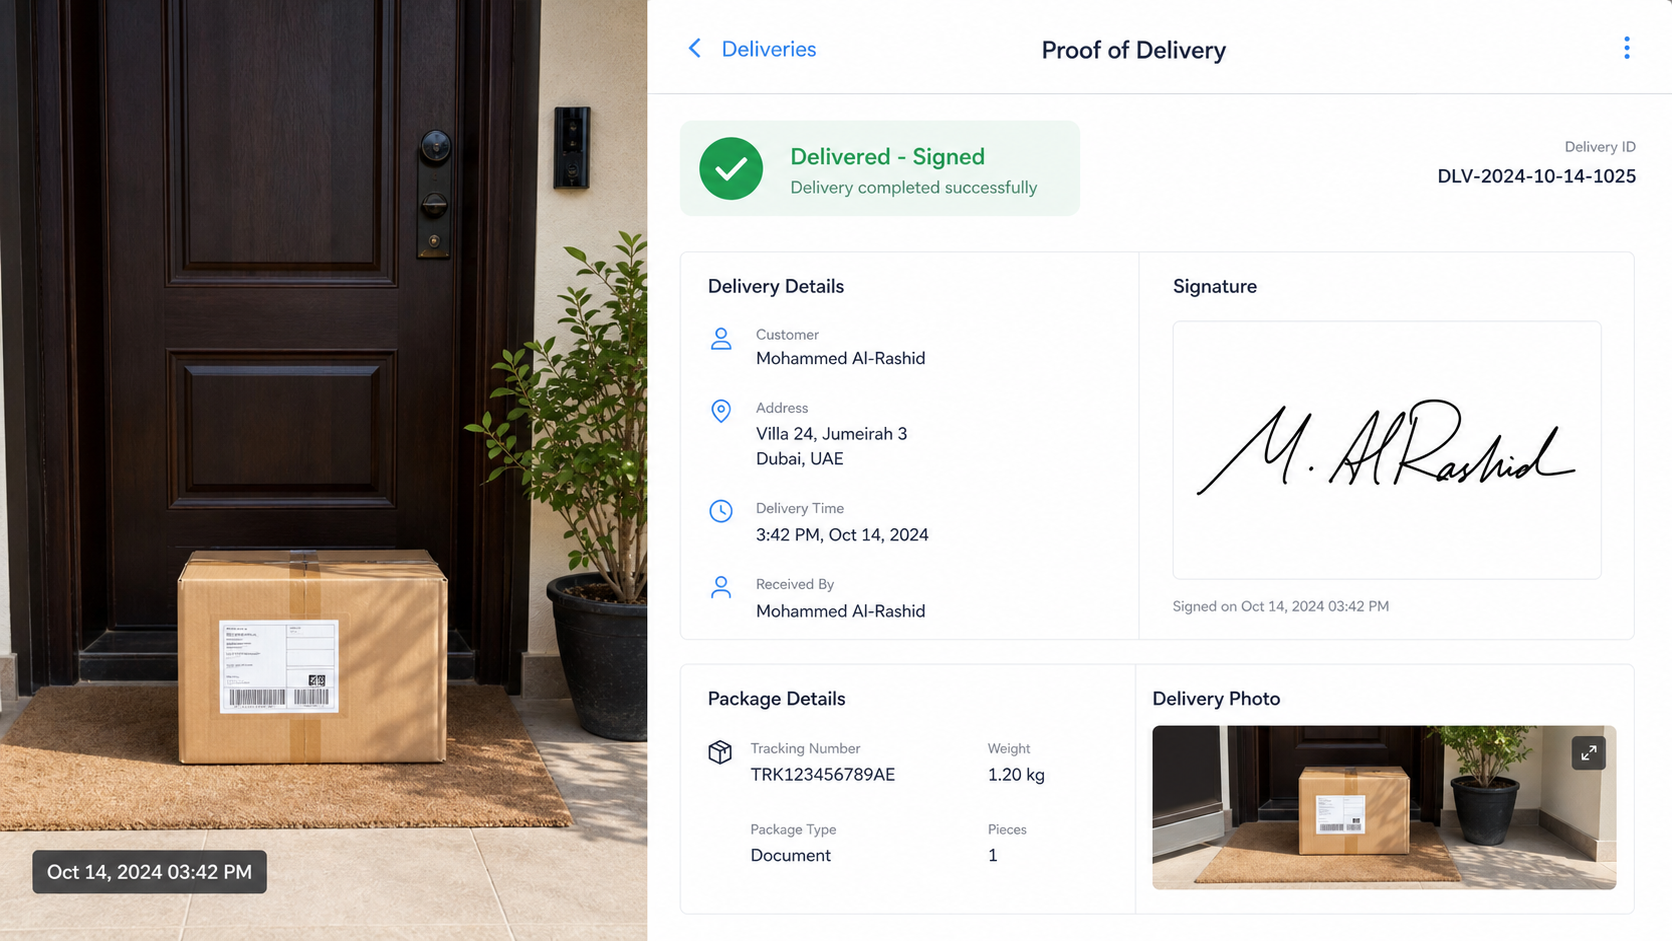
- •Driver captures photo + digital signature on delivery
- •Auto-stored in AWS S3, attached to shipment record
- •Eliminated 8% POD loss rate; invoicing now same-day
Driver & Fleet Analytics
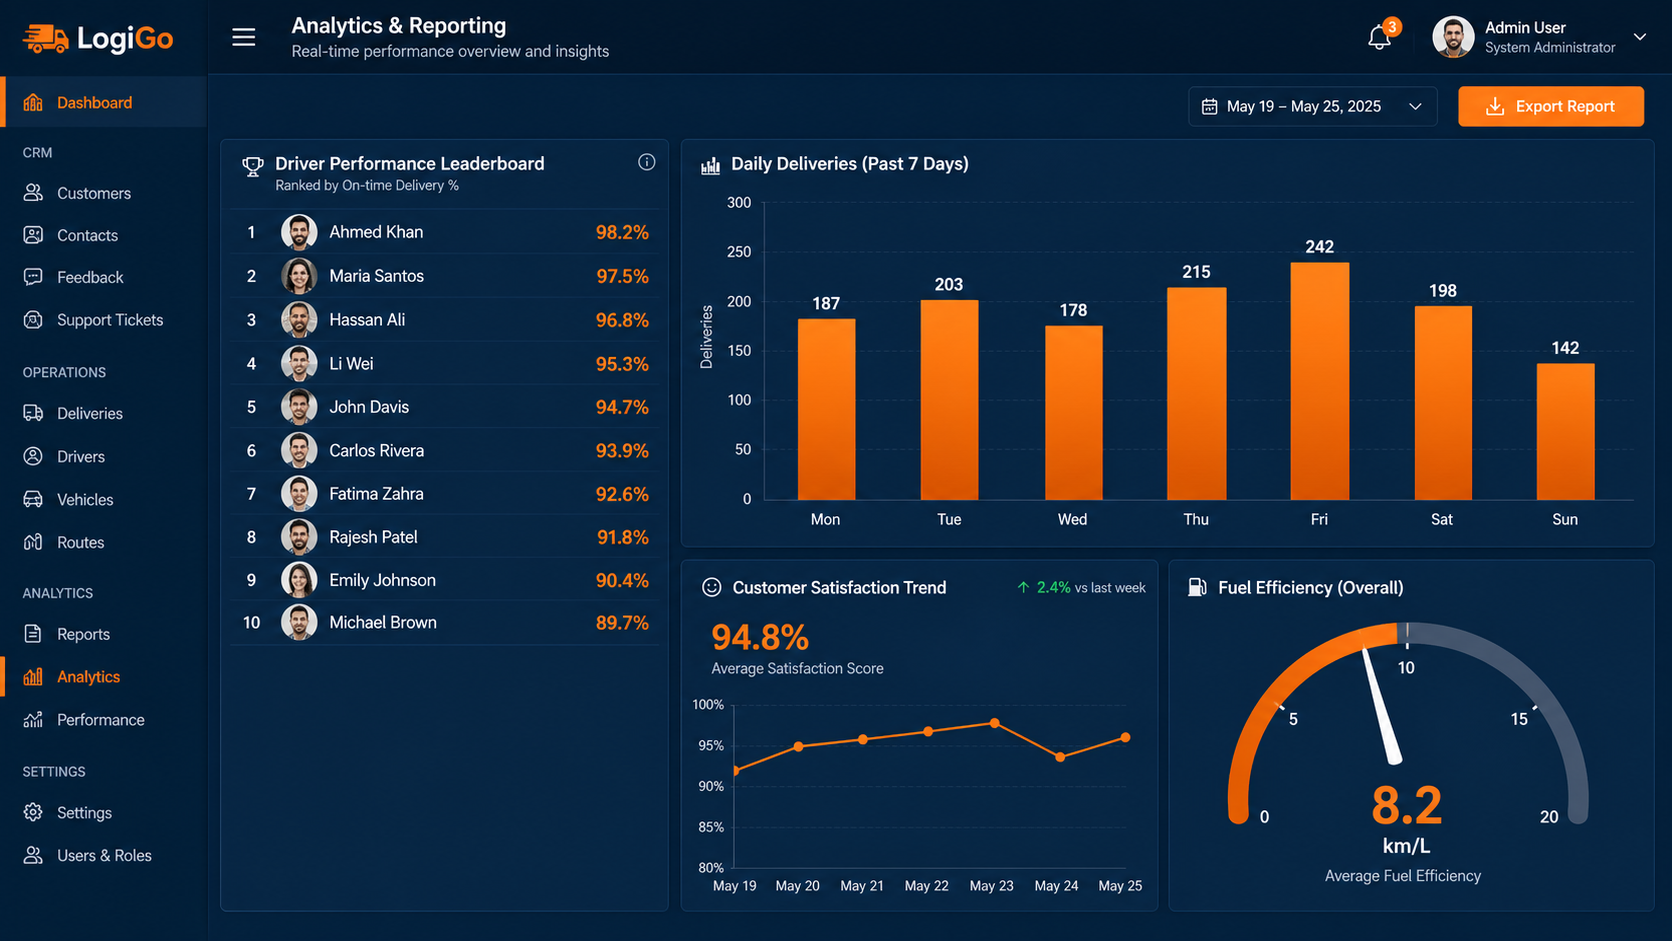
- •Driver scorecards: on-time %, deliveries/day, fuel efficiency
- •Route analytics: actual vs planned comparison
- •Financial dashboard: revenue per route, cost per delivery
Results at a Glance
| Deliveries Per Driver | ↑ 59% (3.2 → 5.1/day) |
| Average Delivery Time | ↓ 40% (4.2 hrs → 2.5 hrs) |
| Dispatch Time | ↓ 99% (45 min → <30 sec) |
| Fuel Consumption | ↓ 22% |
| Customer Complaints | ↓ 95% (40/day → 1–2/day) |
| POD Loss Rate | ↓ 100% (8% → 0%) |
| Operational Cost | ↓ 30% ($85K → $59.5K/month) |
| Customer Satisfaction | ↑ 32% (72% → 95%) |
“XCodeSol transformed our logistics operations. The custom CRM improved delivery times by 40% and reduced overhead significantly. We're saving 30% on operational costs every month.”
Project Gallery